Colocalization
Colocalization analysis of multi-channel images
![]()
napari-colocalization


![]()
![]()

⚠️ Under construction — pre-alpha. APIs, UI, and outputs may change without notice. Not recommended for production analysis yet; use at your own risk and please report rough edges via the issue tracker.
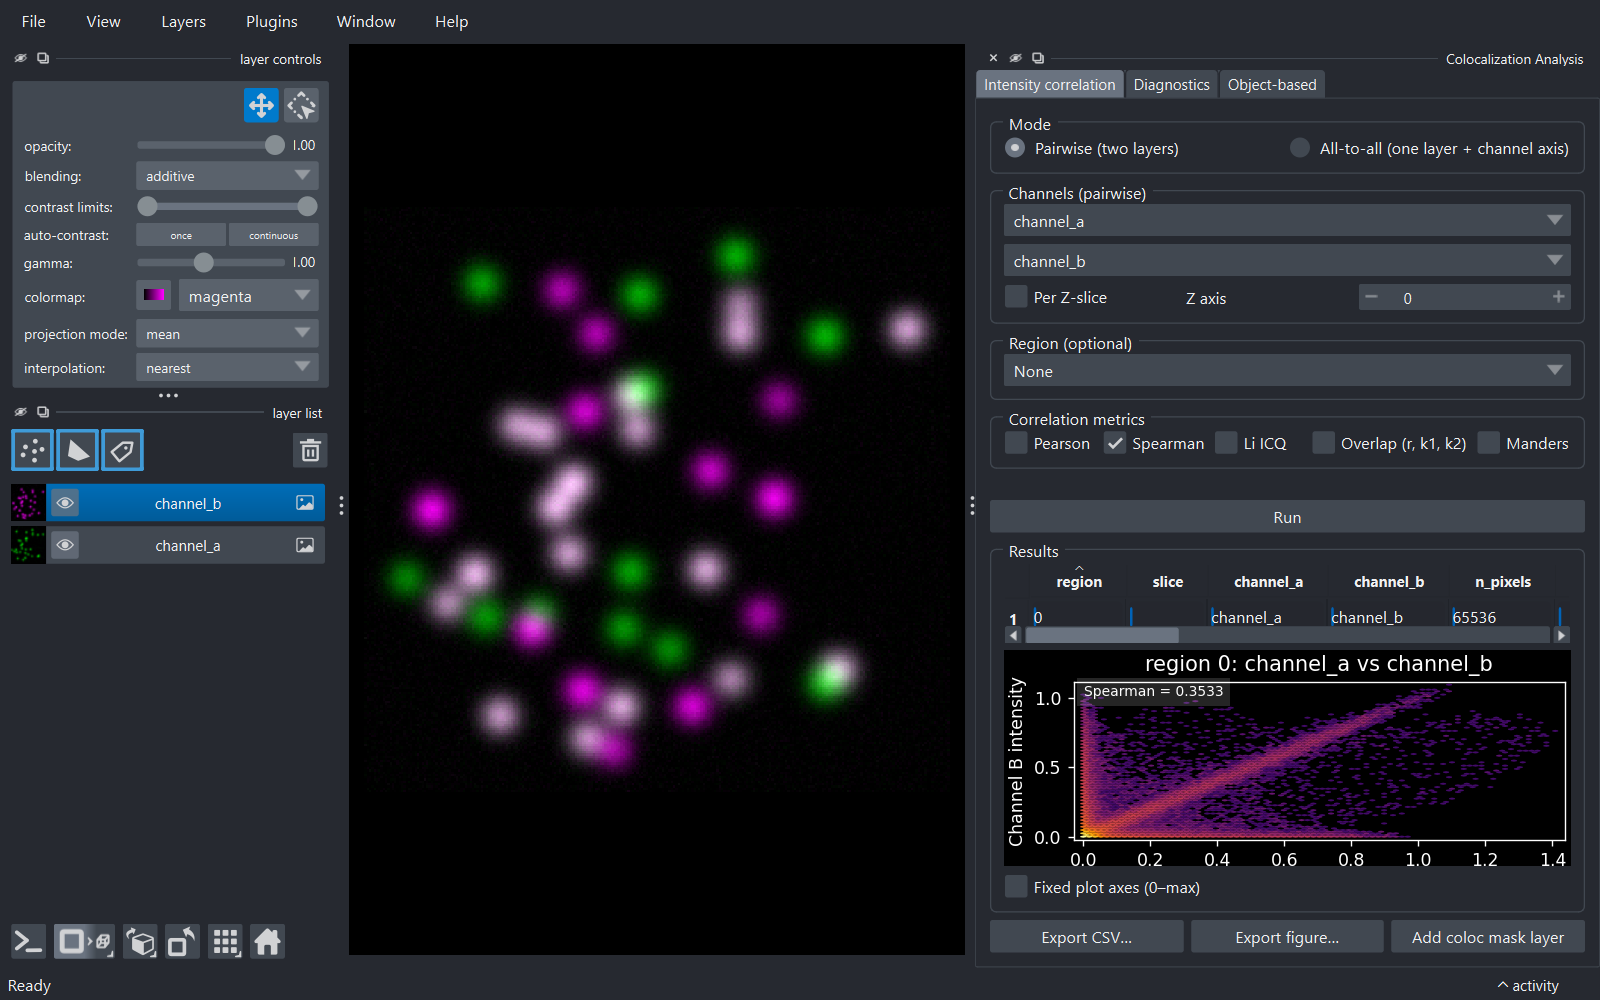
Interactive intensity-colocalization analysis for napari. Pick two channels (or one multi-channel image), optionally restrict the analysis to a region drawn as shapes or labels, choose your metric, and get a results table plus an intensity-vs-intensity density plot.
Features
- Four correlation metrics: Pearson (PCC), Spearman rank (SRCC), Li Intensity Correlation Quotient (ICQ), and Manders' coefficients M1/M2 (MCC).
- Pairwise or all-to-all mode: analyse two grayscale layers, or every channel pair within a single multi-channel layer.
- 2D and 3D support natively (no time-series for now).
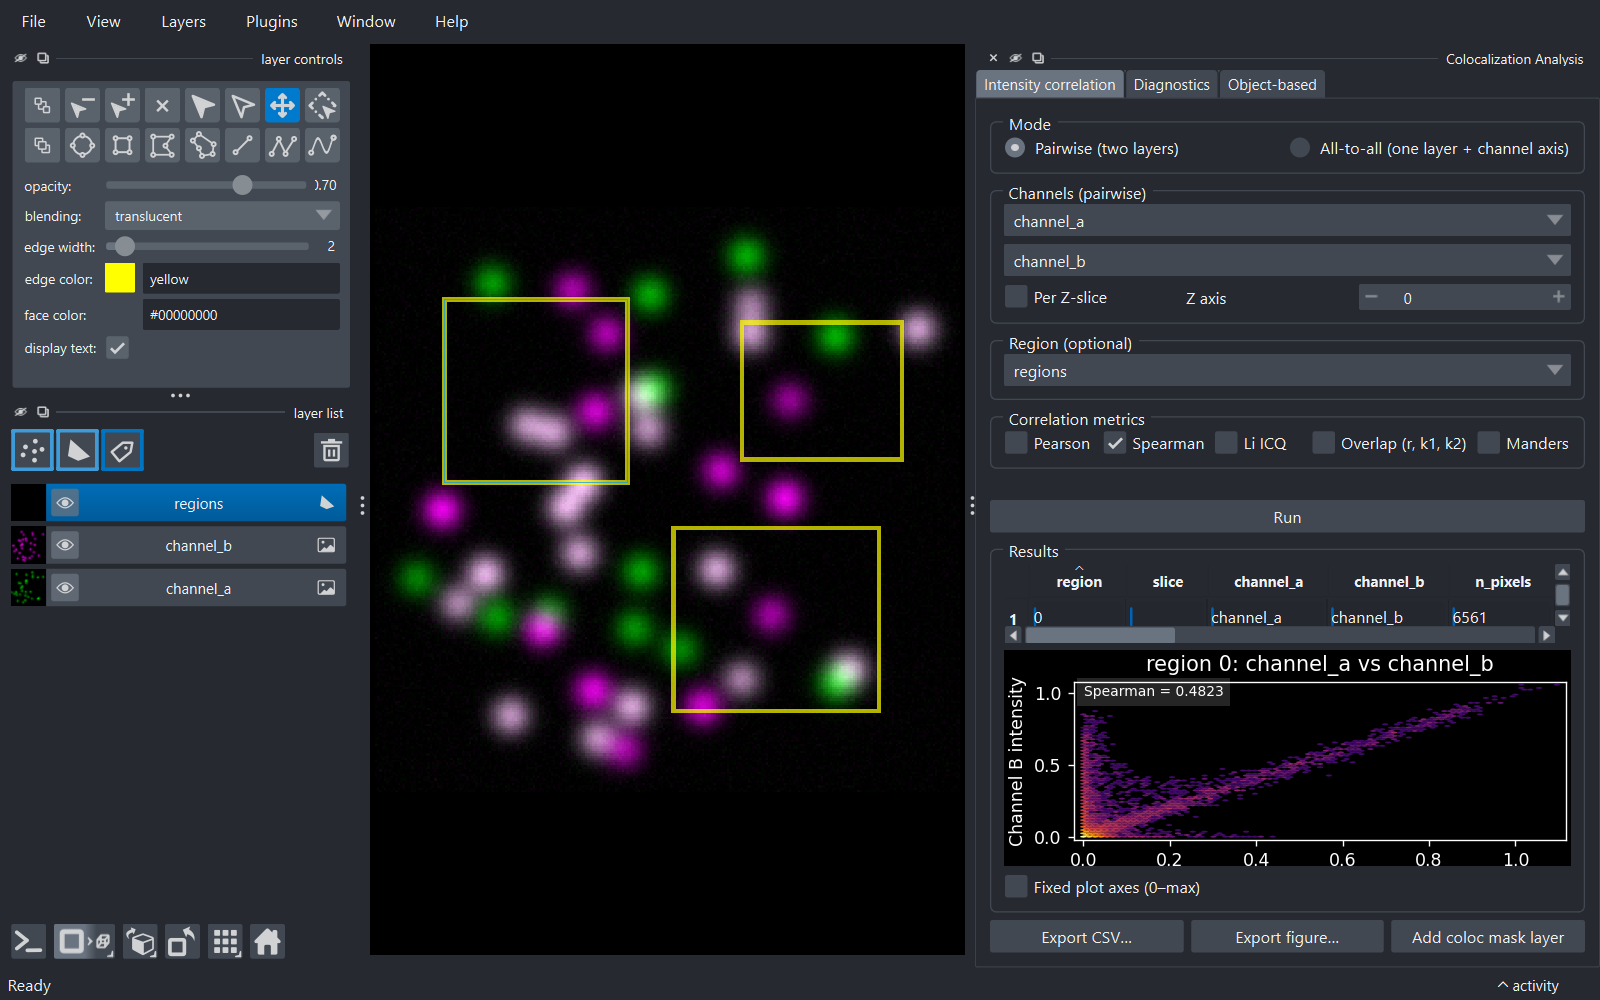
- Region-restricted analysis via a Shapes or Labels layer — each non-zero region is reported on its own row.
- Manders thresholds: choose Costes auto (iterative regression-based) or Manual.
- Interactive results: in-widget table, density plot of the selected row, multi-row selection that highlights all matching shapes/labels in the viewer.
- CSV export of the current table, plus figure export of the density plot (PNG / PDF / SVG / TIFF, configurable size and DPI).
Installation
pip install napari-colocalization
If napari isn't already installed, install both at once:
pip install "napari-colocalization[all]"
For the latest development version:
pip install git+https://github.com/DBI-INFRA/napari-colocalization.git
Quick start
-
Launch napari.
-
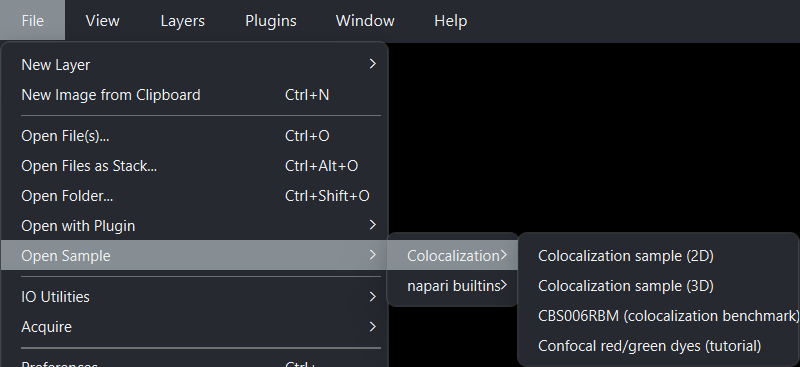
Load sample data: File → Open Sample → napari-colocalization → Colocalization sample (2D). A 3D synthetic sample and CBS006RBM — a two-channel benchmark image from the Colocalization Benchmark Source — are also provided.
-
Open the widget: Plugins → Colocalization Analysis. Two image layers
channel_aandchannel_bare auto-selected for pairwise mode. -
Click Run. The results table populates with a single row (the whole image), and the density plot below shows the intensity pairs with the metric values overlaid.
- (Optional) Add a Shapes layer, draw a few rectangles or polygons, set Region to Shapes and pick the layer. Re-run — the table now has one row per shape, and clicking a row highlights the matching shape in the viewer.
See docs/usage.md for the full walkthrough.
Documentation
- Usage guide — every control in the widget, in order.
- Metrics — what PCC, SRCC, ICQ and MCC mean, when to use which, and how the Costes auto-threshold works.
- Python API — calling the pure-compute layer
(
pearson,spearman,li_icq,manders,costes_threshold,analyse_pairwise,analyse_all_to_all) from scripts or notebooks.
Related projects
- Coloc 2 — the reference ImageJ colocalization plugin; this plugin follows it in spirit.
- scikit-image colocalization metrics — the underlying implementations of PCC and Manders.
Contributing
Contributions are welcome. Run the test suite with:
pip install -e . --group dev
python -m pytest tests/ -v
Pre-commit hooks (ruff lint + format, napari-plugin-checks) ship with the repo:
pre-commit install
pre-commit run --all-files
Please keep test coverage at or above the current level when submitting a PR.
License
Distributed under the terms of the MIT
licence; napari-colocalization is free and open-source software.
Issues
Found a bug or have a feature request? Please open an issue.
Version:
- 0.1.6
Last updated:
- 2026-06-17
First released:
- 2026-04-30
License:
- MIT
Supported data:
- Information not submitted
Plugin type:
Open extension:
Save extension: